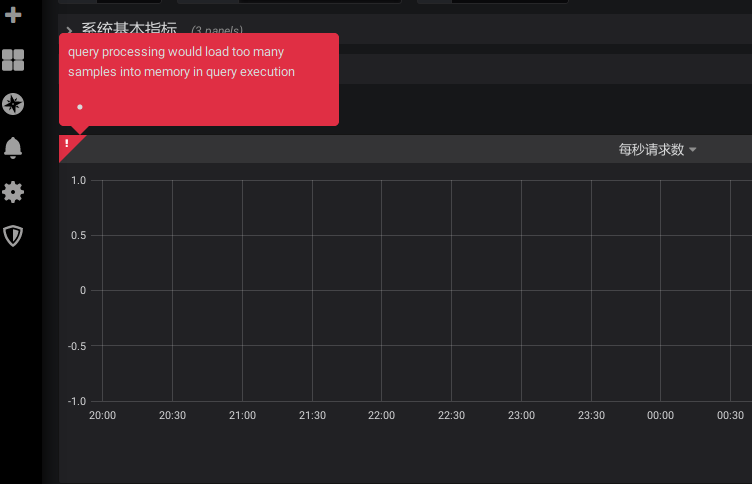
在 Grafana 中有的 dashboard 只要时间范围选择稍微长一些,dashboard 就展示就会失败
query processing would load too many samples into memory in query execution
由于 PromQL 语句可能会载入大量的 metrics 数据,导致 Prometheus 内存以及 CPU 消耗超标,所以 Prometheus 提供了相关命令行参数,防止复杂的查询耗光资源
–query.timeout=2m
Maximum time a query may take before being aborted.
–query.max-concurrency=20
Maximum number of queries executed concurrently.
–query.max-samples=50000000
Maximum number of samples a single query can load into memory. Note that
queries will fail if they try to load more samples than this into memory,
so this also limits the number of samples a query can return.
Prometheus 时序数据模型参见 Data model | Prometheus
Prometheus fundamentally stores all data as time series:
streams of timestamped values belonging to the same metric and
the same set of labeled dimensions.
每 <metric name>{<label name>=<label value>, ...} 值对应一 time series 。
如下两条 metric 由于 user_agent label 值不一样,从而属于两个 time series
nginx_http_response_count_total{request_uri="/index.html",method="GET",status="200",user_agent="Dalvik/1.6.0"}
nginx_http_response_count_total{request_uri="/index.html",method="GET",status="200",user_agent="Dalvik/2.1.0"}
当某些 label 取值较多的情况下,会导致 time series 过多,导致无法展示。
可以打开 http://prometheus.yourcompany.com/graph 实际执行一下查询语句,看一下查询性能, time series 过多时查询最近一个小时
Load time: 21119ms
Resolution: 14s
Total time series: 18435
做一个简单的计算(采用默认的 scrape_interval 值 15s )
60*60/15*18435=4424400
假设 time series 数不变,最多只支持查询 11.3(50000000/4424400) 小时数据。